
Speeding Up Your Website
Sooner or later every website owner who is paying attention to whether their website is really working for them or not comes to one conclusion … they need to get their website to load faster.
That’s a message that they’ve probably been hearing for years but they either don’t believe it … or they don’t know how to make the site load faster … so they do nothing.
But eventually they’re confronted with the fact that their website is costing them money but isn’t delivering the outcomes they want because it is so slow … and just to reinforce that message they might have also got a warning from Google about the speed of their website.
When all those come together they begin to realise that they need to either fix the problem or throw their website away.
If that’s where you are with your website right now, then this article is for you because I’ll show you how I shaved a whole 7 seconds off the loading time for this website and I’ll make that explanation as simple as I possibly can.
Step 1 – Ignore the “Experts”
Pay no attention to the “experts” who want to tell you that the only thing you have to do to fix the loading time problem if your website is built on a content management system is to install a caching plugin. To put it bluntly, they’re WRONG.
Sure, a caching plugin might speed your website up but it’s also going to mask all the other speed-related problems that you should fix if you really want to get the best out of your website.
And you really do need to fix all those other problems before your website grows any bigger.
Step 2 – Test the speed of your website
This can be information that you don’t really want to know but if you want to fix the problem then you need to know how bad it really is.
The first thing I do is look at a little extension I have in my Chrome browser – it measures the time it takes for the web page I am visiting to load.
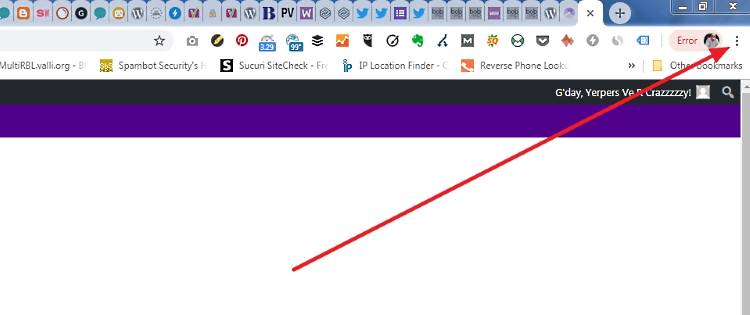
It’s called Page Load Time and, if you use Chrome as your browser, you will find it by following the arrow and then clicking on More Tools > Extensions.
That little tool told me that the front page of Crazy Lady was taking 9.341 seconds to load … and this was a page that appeared to have nothing more than a simple header. some text on it and a sidebar full of text.
At first I thought that it was joking … but sadly it wasn’t.
So install that extension and then see what it says about the page you want to test. Expect a scary number and you won’t be disappointed but don’t let the shock stop you from making a note of that loading time.
Then go to WebPageTest.org; type your domain name into the field at the top of the page and then choose a test location/ browser combination from the drop-down menu.
Choose the location that is closest to where your target market lives and then, to keep it simple, choose a desktop browser.
You may be able to see my choices in this image.

While most people may be using a mobile device to visit your website the fact is that if your site is slow on a desktop then it’s probably going to be even worse on a mobile device … so I would suggest that you choose the desktop results and start there.
The savings you make on the desktop version will flow on to the mobile version.
Step 3 – Read the figures
Once the test is completed you will get the results and, if they look like these results then you should be fairly happy because these results are for one of my design clients and we haven’t done anything to speed up his website … yet.
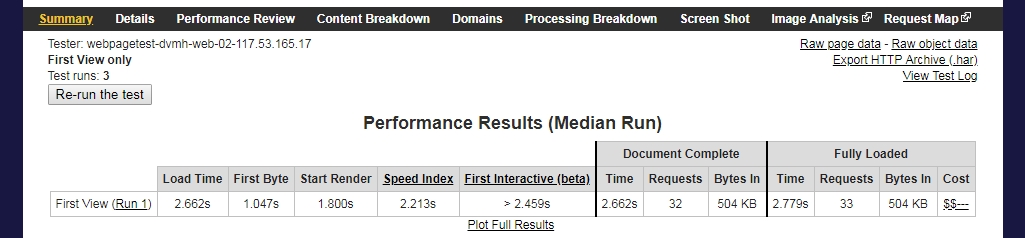
The results you need to pay attention to when your results show up are:
The time it takes for the first byte to load.
The time it takes for the site to begin to render and
The load time
The time it takes for the site to fully load is important too but the first load-time figure is the time it takes for the visitor to think that the site has loaded. Some things can load in the background … or several scrolls down … before a site visitor reaches that point.
As you go further into reducing the time it takes for your pages to load the number of requests and the file size of the page will become more important, but for now, just focus on the three numbers I mentioned above.
The time it takes for the first byte to load should be around 200 milliseconds and anything above 400 milliseconds is an indication that your website is probably hosted on a slow server.
The time that it takes for the site to begin to render is the time it takes for the site to begin to appear on the screen. If that’s longer than two seconds then people are starting to leave your website and they will probably never come back.
The load time is the time that it takes for the first visible screen to be fully loaded. Anything over 3 seconds and you will be losing even more people.
I should say here that some research has been done on how quickly people leave a website and there is some suggestion that if they really want to see your content then they will stick around longer than the average visitor … but I wouldn’t bet my business on it.
So now you have some figures to work with, what comes next?
Step 4 – Getting to work
What I am now going to walk you through are the simple steps I took to take a big chunk out of my website’s load time.
More than meets the eye
Start by accepting the fact that there are more speed humps on your website than meet the eye and the server you are on is just one of them and, like installing a cache plugin, it’s not the first thing to tackle.
The first thing to think about for me was what was happening in the background.
The front page of my website was simple … a header and then nothing but a bunch of text on the page and in the sidebar. There was nothing there that should have slowed things down so maybe there was something happening that I couldn’t see.
I couldn’t see anything in the coding but there was a chat panel loading at the bottom of the page via a plugin but that wouldn’t be taken into account when measuring the load time of the page would it? It was pulling stuff in from an external source so that wouldn’t slow the loading time for my site would it?
There was only one way to find out. I de-activated the plugin and reloaded the page in the browser as well as running the speerd test again. The browser load time dropped by 4.07 seconds.
Obviously content that is loaded from an external source does count against the load time for your website so … and that includes things brought in via iframes too (things like Google Maps).
So did I really need that chat panel?
It was important to give people a way of contacting my business but what was the point if no one was going to stick around while the page slowly loaded? What was the point of having that chat panel if no one found my site because Google had imposed a time penalty that kicked it off the front page?
I deleted the chat plugin.
Install Jetpack … no I am not insane.
The next thing I did was to install Jetpack. Now if you talk to people who obsess about website speed you will soon learn that Jetpack is a resource hog that can slow your site to a crawl and many of those people avoid Jetpack like the plague.
But there are some useful little tools in Jetpack and you can install those useful tools and turn all the others off.
Doing that will quickly turn Jetpack from a resource-eating monster into something far more useful and I took to Jetpack with a chainsaw. By the time I finished Jetpack on my site was running just two things … Photon and Lazy Load.
To achieve the same result install Jetpack and accept the fact that the only option you seem to have is to install all their recommended bits. Once you have done that scroll all the way to the bottom of the page and find the Debug link.
Click that link and then scroll all the way to the bottom of the page where you will find this link “Access the full list of Jetpack modules available on your site”. Click that link and the next screen will allow you to turn off everything you don’t want.
I left Photon and Lazy Load active because Photon is a very simple and free content delivery network (CDN) so my server won’t be serving images for my website anymore. Now they will come from the faster Photon servers.
Lazy Load reduces the loading time for a website by not loading any images that won’t appear on the first screen. Instead it will load everything on the visible part of the first screen and the browser will think that everything on the whole page is loaded but, it then goes back to loading whatever appears below that first screen before most site visitors will scroll that far.
Optimize your images
You should never just rely on these two scripts to compensate for images that have huge file sizes.
You should always optimise your images before uploading them and NEVER upload images that have come straight from a camera.
I run every image I use through image software that reduces the physical size of the image to the size I want to use on the website and the file size to something that still looks good in a browser but is a lot smaller in file size than the original image.
A lot of people don’t do that. They upload images that are huge in physical size and file size and expect the browser to do all the work of resizing the image … and then wonder why their website takes so long to load.
And don’t use PNG or bitmap files no matter what people tell you … stick to .jpg files for images.
Now it’s time for a caching plugin
After working through those previous steps it was time to think about a caching plugin.
There are several that will work with WordPress but I wanted to start with something simple so I installed and activated WP Super Cache.
Once the plugin was activated I went into the settings and on the ‘Easy’ tab turned caching on.
On the Advanced and Preload tabs I ticked the recommended options and then went back to the ‘Easy’ tab and clicked the ‘Test Cache’ button to make sure that everything was working.
After I did all those I ran the page through WebPageTest.org again.
The first byte time dropped from 2.649 seconds to 0.38 seconds. That’s not wonderful but it’s a whole lot better than it was.
The test load time dropped from 4.94 seconds to 1.879 seconds and on my browser the load time had dropped from 9.341 seconds to 2.01 seconds.
That’s just the start
We partied for all of 10 seconds and then decided that we can do a whole lot better.
I need to look at the plugins I’m using because there are faster ones that will do the same job as the ones I have.
I need to look at the Theme I’m using because I can turn off things in there that I’m not using
I can look at optimising my images even more
I can even take the drastic step of moving to a faster server
… and that’s just the start.
If you want a faster website then that’s just the start for you too and what I’ve done on Crazy Lady are simple things that you can do for your website.
What comes next is the harder work where there are no big wins but just savings measured in milliseconds. This work is slow and methodical and can seem dull and boring … but the benefits can be huge so it is definitely worth making the effort.
Of course, if you can’t then contact me and my team and I will do the work for you.
PS: Since writing this I haven’t had much time to work on my own site but I am using a new tool and I’ve have managed to shave a a few more milliseconds off the load time.
The time to first byte is down to 285 milliseconds and it is now fully loaded here on the east coast of Australia in 1.2 seconds.
The tool I’m now using is GTMetrix and setting up a free account gives you access to a lot of important data about the load times for your website.